03 Apr 2017
Here is a cool figure that I made with S. J. Schmidt a few years ago at a research retreat in beautiful Friday Harbor, based on work she was doing with APOGEE + WISE data for low-mass stars (see very relevant paper here)
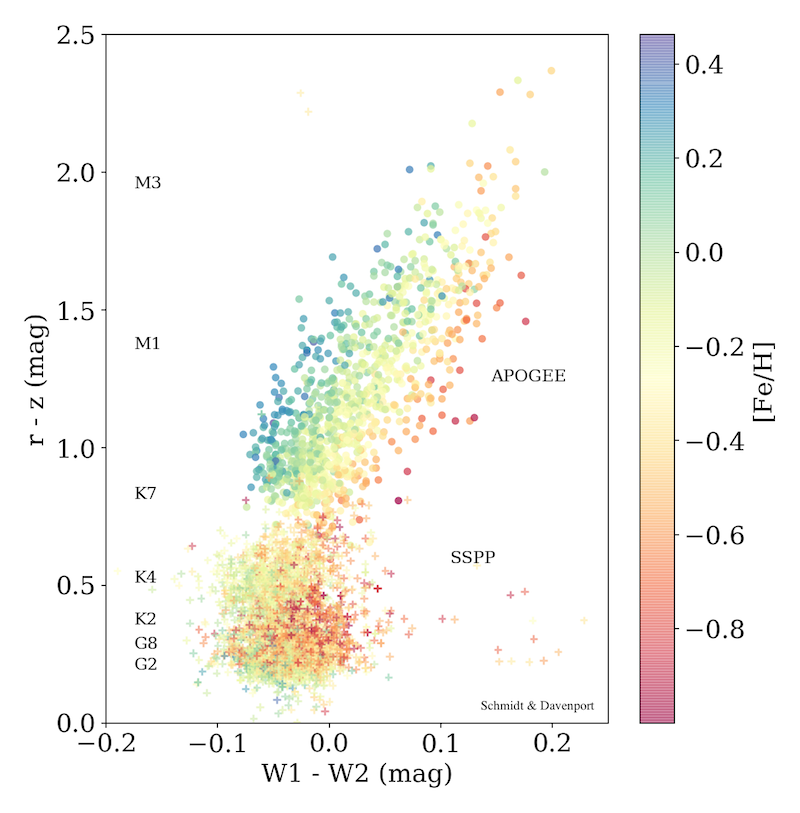
We added to her APOGEE work by including dwarf stars processed by the SDSS Stellar Parameter Pipeline (SSPP).
What comes out of this figure is a potentially useful result: you can measure the metallicity of a star (roughly) using it’s WISE (W1-W2) color!
For M dwarfs, the [Fe/H] values can be determined by subtracting the measured (W1-W2) color from the stellar locus value for a given (r-z) color. This is a fairly small amplitude signal, however, with the offset in (W1-W2) having a max of +/-0.1 mag. The effect is less pronounced for earlier type stars (GK) measured by SDSS, but is still in the same direction about the locus.
Next Steps
- What is the cause of this signal?
- molecular features that show up for cool stars and are metallicity dependent I guess
- If we update the sample w/ latest public data from SDSS (BOSS) and APOGEE, is the signal still there?
- Can we find more cool dwarfs in APOGEE? (>M4)
- (W1-W2) appears to broaden through M dwarfs. Does it continue?
- Is the signal at all measurable for earlier type (GK) stars?
- Fit a 3D polynomial to parameterize
- Redo as function of (J-W1) instead of (r-z)
- then doesn’t depend on SDSS photometry, can be done for all WISE stars!
- [Fe/H] map of nearby Milky Way?
- use Gaia to pick only dwarfs
What I need: People who know more about the current state of the field for “chemical cartography” of our Milky Way. Is it still exciting to measure [Fe/H] gradients? Look for kinematic+chemical substructure?
09 Mar 2017
One of the more amusing SETI articles in recent memory is one suggesting lasers could be used to “cloak” a planet’s transit, by essentially filling in the missing starlight occulted by the planet. This raises an interesting observable question: Do we ever see transits go missing?
There have been examples of eclipses (i.e. two stars) changing depths over the course of the Kepler mission. These are neat, and usually attributed to the viewing angle of the system changing.
Transit Timing Variations (TTVs) are all the rage, as the slow drift/change of transit occurrence times points to additional planets/bodies in the system. What you observe is a periodic transit event slowly falling ahead/behind schedule as the 3rd body moves around it.
However this idea is much simpler, and driven by the SETI question: Do any transits fail to show up when we’d expect them to?
##Game plan:
- Get list of all available transiting planets in Kepler without transit timing variations (TTVs)
- Obtain long cadence (30-min) light curves for each system
- Using published periods & times for transits, step through light curve and verify transit is present if data is available (i.e. missing data doesn’t count)
On some level this is a “reality check” exercise. I would basically not expect to find any published planets to have missing transits, as I think this would cause undue scatter in the phase-folded data that would have led to their rejection. However given the entertaining SETI angle, it does seem worth it to at least check!
06 Mar 2017
At the ISSI meeting I attended on quasi-periodic pulsations (QPP’s) in stellar flares in Switzerland in 2017-March, we had a great demo of the time-tagged photon data from GALEX by Scott Flemming & Rachel Osten, and the Python toolkit called gPhoton. This enables high time resolution (maybe 1sec) studies of stellar variability in the NUV (and FUV). Many projects came to mind from our group with this tool/dataset, including searching for QPP’s naturally.
Long-Term Variability
Some sources available with gPhoton have data from up to 10 years of repeated visits with GALEX! This caused me to wonder about the possibility of seeing long time-scale variability in the UV, which we might use to observe stellar activity cycles using GALEX! By using a list of Mt. Wilson H&K stars from Duncan et al. (1991), I wrote a quick Python script to ping the gPhoton database and count how many visits to each star were available.
Note: After corresponding with the gPhoton folks, it seems this may be a less efficient approach, and that an SQL-style database is also available for visit-level data that may suffice. Comparison of gPhoton with this coarser data is required!
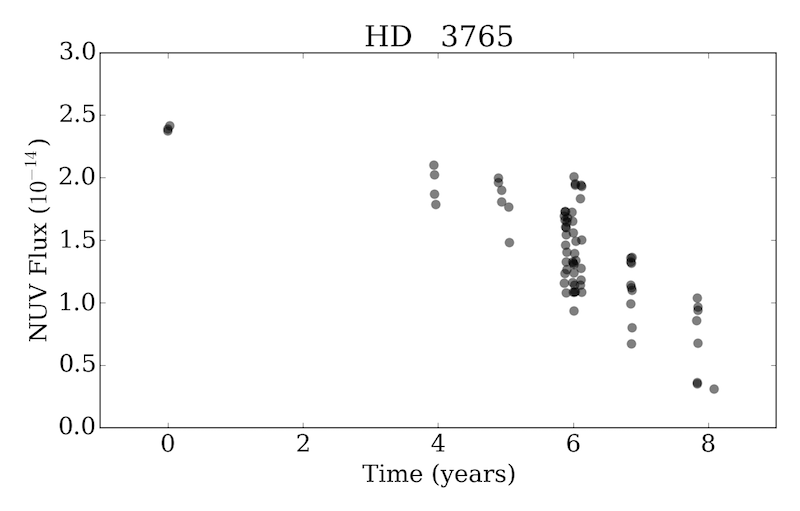
Here is the decade long light curve for one star, chosen to have the largest number of visits available (over 70). Each data point is the median flux value within the visit. The evolution is very interesting!
Next Steps
- Create a similar light curve for every Mt. Wilson (and other H&K survey) stars, looking for long-term variations.
- Compare the gPhoton with SQL-level data, to ensure variability is real
- Compare with the Gezari et al. (2013) catalog of variable GALEX sources
Python notebook on Github
Age-Activity
Following my recent exploration of rotation period distributions using Kepler & Gaia data, I was keen to see if the GALEX data showed any correlation between UV flux and stellar age. Activity levels traced versus stellar age with GALEX have been explored by Shkolnik & Barman (2014), using stars with known ages from clusters.
Instead of gPhoton, I used a dedicated dataset built from GALEX observations of the Kepler field by Olmedo et al. (2015). Using the excellent CDS X Match Service, I quickly and effortlessly matched this catalog to the McQuillan et al. (2014) rotation period dataset. To get more photometry, I then matched this combined catalog to SIMBAD with X Match. In a matter of 30 minutes from the airport I was able to get the data to make this figure:
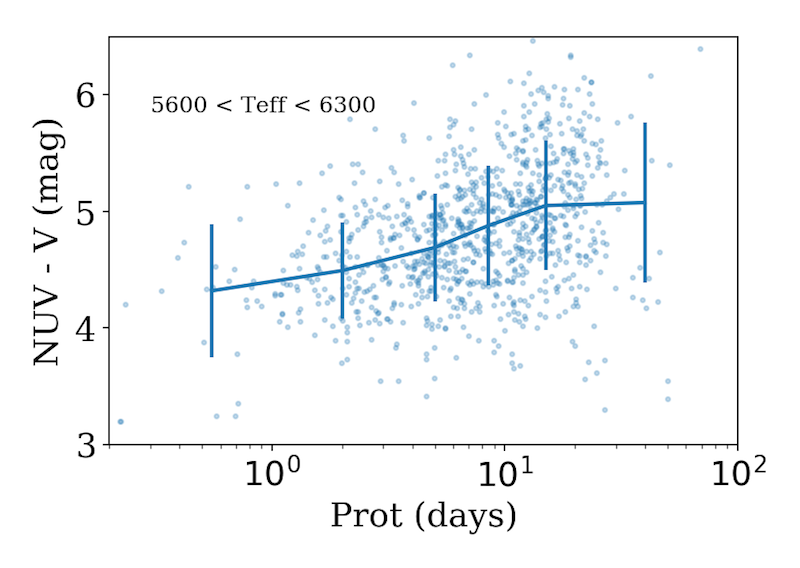
For stars with a small range of temperatures, we can see the NUV flux appears to decrease compared to the V-band as a function of rotation period. Here I use the NUV-V color, as it is distance independent, and small bins in temperature to minimize the effect of different stars inhabiting different ranges of rotation period causing artificial spreads in the color. The evolution of less UV activity with increasing age (rotation period) is in the direction that is expected. However, the scatter is quite large.
Next Steps
- Improve sample selection with quality cuts for all data.
- Make similar plot for all available temperature bins
- Make plot as a function of Rossby number instead of rotation period
- Using a gyrochronology relation to infer rotation ages, plot the expected UV flux (or NUV-V color) from the fits of Shkolnik & Barman (2014) versus the GALEX data.
- Can we see a saturation regime with this data? If so, this dataset may be a valuable and large addition to the available sources!
- (Longer term) extend this sample with rotation periods from K2!
Python notebook on Github
25 Feb 2017
Background
I had an epiphany in early 2016: The moon goes through the K2 fields. I mean, of course it does by construction. K2 has to point along the ecliptic due to using the solar wind as a 3rd axis stabilizer. The moon travels along ecliptic. In hindsight, it is very obvious.
This provides a unique opportunity: Lunar occultation studies of K2 targets.
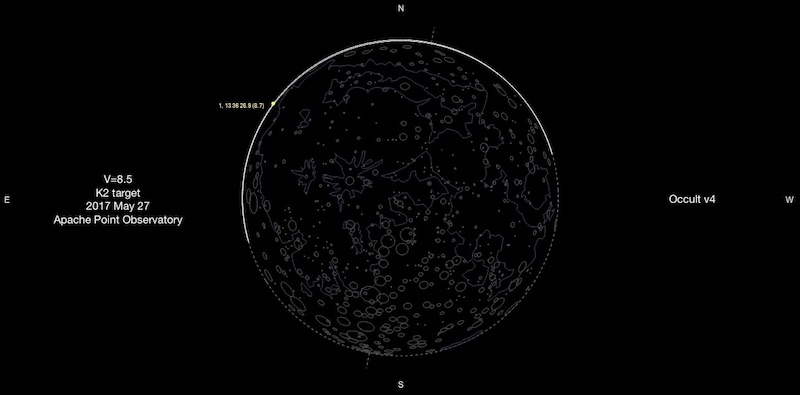
Such a project for community observers of occultations was described by the Occult software maker, Dave Herald, in this forum comment as an idea pitched by James Lloyd. The banner figure above is an example occultation in May 2017 of a K2 target observable from APO, as computed by Occult v4.2.0
Lunar occultations can be used to estimate the angular diameter of background stars. It can also be used to determine if a star is actually a binary! Check out these toy examples I coded up:
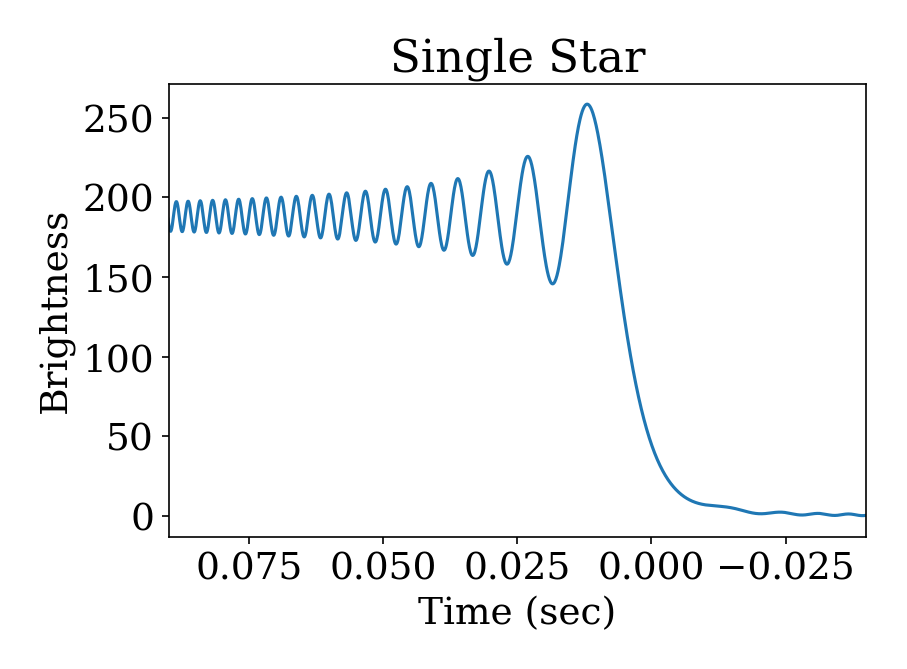
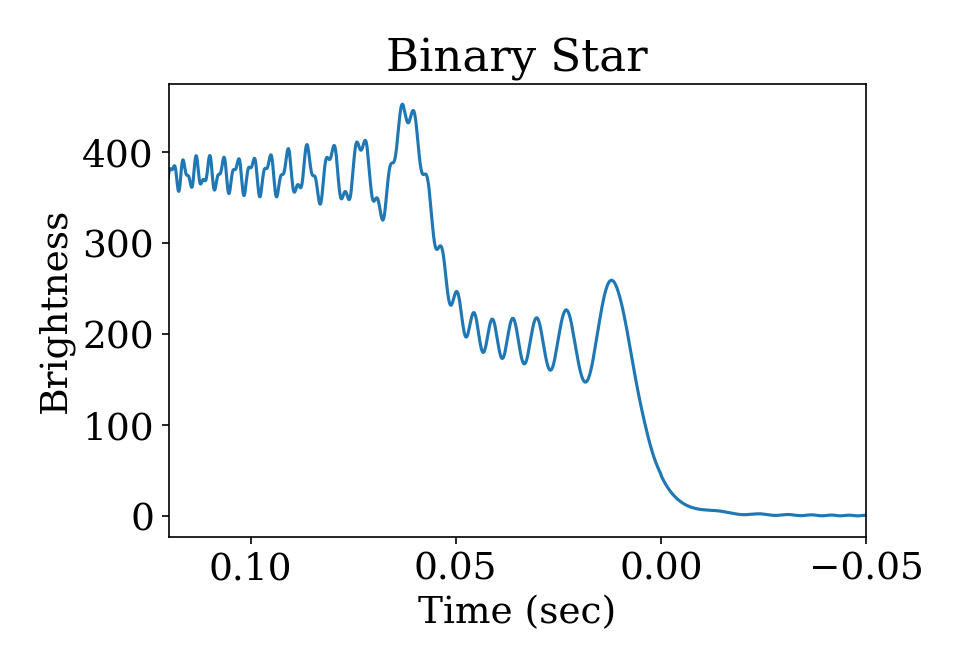
Occultations allow binaries to be detected at milli-arcsecond separations, assuming the stars are separated along the direction of occultation, and can detect companions up to 11 mag fainter! This means occultations could even be used to detect exoplanets with next-generation large telescopes.
Here is a nice review of the methodology and technical considerations from 1994 by Richichi, where the author notes the field of occultations has been relatively stagnant for 20 years. Unfortunately more than 20 years hence, the same is largely true, and LO remain a fringe technique for stellar astronomers.
Challenges
The first and most obvious constraint to occultation work is the limited number of stars available for study. To wit, we only have 1 moon… though other Solar System body occultations of background stars are frequently observed (e.g. Saturn, asteroids, etc), and are good targets for JWST study - but these are for understanding the Solar System, not stars!
We are also put off by the need for very high speed imaging, often at infrared wavelengths. The events last only a few 100 ms at best, requiring an ultra-fast CCD or video camera system. The Signal-to-Noise requirements of 1-10ms exposures means that occultations are typically only possible for very bright stars, often V<8.
There are other considerations for observing wavelength and telescope diameter, as we are working to measure the diffraction of starlight by the lunar limb.
A Solution?
Fors et. al (2001) described an alternative approach to measuring occultations that particularly appeals to me: drift scanning. (First proposed by Sturmann in 1994) In this approach we read the CCD (camera chip) out at a rate that smears the starlight over many pixels. Since the CCD read is at a constant rate, the time evolution of the event is preserved, often at a resolution of a few ms. Note we are reading the camera while the shutter is open. This is basically the opposite of what SDSS did, where the CCD’s were read at the same rate the sky was drifting by, causing starlight to not smear as the charge moved along the chip, but gave continuous images of the sky. (brilliant!)
This drift-scan approach is attractive because it only requires an off-the-shelf CCD chip, and a little help from some adventurous engineers (e.g. the readout clock speed needs to be tuned, shutter needs to stay open, etc)
With access to lots of telescope time (actually very little time per object!), and minimal changes to a facility instrument, a survey of occultations for K2 sources should be undertaken! I can think of 1 or 2 medium aperture telescopes this would be ideal for…
Future
Drift spectroscopy? Could be possible with a longslit spectrograph (one way time resolved spectroscopy was done in olden days…)
24 Feb 2017
There are some awesome surveys of variability that are being under utilized. One such gem is OGLE, which now has a catalog of over 48k eclipsing binary star systems in the SMC and LMC!
With such a large sample, and near complete coverage of SMC/LMC (and in-between….) it would be amazing to see: are there variations of the eclipsing binary star population over an entire galaxy?
To do so, you might combine this variability survey with other spatial surveys that have traced the star formation history of the LMC/SMC… here’s a more recent paper on the subject.
We (or at least I) might naively expect that the orbital period distribution would be changed as a function of mean age of the stars in a spatial bin - in other words, dynamic processing would harden (shorten) the periods over time. Long period, detached systems would become more rare over time, and so also increasing the fraction of W UMa type systems.
Here’s a catalog with some updated fits to the light curves for the OGLE-III LMC systems.
Finally, working in the temporal-spatial domain is good practice for the forthcoming “LSST era”. As they say, publish early, publish often!